Tags
#coding
#pureImagination
#appCode
Pure Imagination
- Environmental monitoring with online data logging to Thingsv
- Inventory
- Hessian/ burlap/ crocus composites
- CNC milled wood frame
- Grow monitors | What watches the watchers?
- Grow module | Design and fabrication
- Grow Module | The science
- Processing Light Graph
- Milling a composite mold
- Composites : Modular growth, testing
- Bio-electro-chemistry
- Bioelectrochemical testing pod
- LCD x Arduino
- Precedents
- Discussion
- Design, Materials and Methods
- History : Early concepts
2017 May 24
#coding
#pureImagination
#appCode
Enough with the tutorials. Now I would like to start putting these together with some kind of simple visual or audio interface connected to sensor readings.
I started by looking at this former Fab Academy student's work mapping phototransistor settings to a dynamically configurable 3D model. He was able to combine sensor readings from arduino with a Processing sketch from Open Processing Org, a wonderful place for sharing processing sketches. I went there with the intention to grab a sketch, however I was a little overwhelmed so instead I started looking at former Fab Academy students' pages for a sketch I might be able to digest.
After some searching, I found Shunichi Mizugaki's Fab Academy Page. He wrote this sketch to make little bar graphs for his accelerometer sensor.
And he was friendly enough to share his code. Which looked like this (for convenience):
import processing.serial.*;

Serial myPort;

int in_x, in_y, in_z;
int cnt;

color[] col = new color[6];

void setup() {
size(800, 400);
frameRate(40);
myPort = new Serial(this, "/dev/cu.usbserial-FT91COUK", 9600);
initGraph();
}

void draw() {

//x axis
fill(col[1]);
float tx1 = map(cnt, 0, width, 0, width);
float ty1 = map(in_x, 0, 200, height, 0);
ellipse(tx1, ty1, 4, 4);

//y axis
fill(col[2]);
float tx2 = map(cnt, 0, width, 0, width);
float ty2 = map(in_y, 0, 200, height, 0);
ellipse(tx2, ty2, 4, 4);

//z axis
fill(col[3]);
float tx3 = map(cnt, 0, width, 0, width);
float ty3 = map(in_z, 0, 200, height, 0);
ellipse(tx3, ty3, 4, 4);

if (cnt > width) {
initGraph();
}

cnt++;
}

void initGraph() {
background(47);
noStroke();
cnt = 0;
col[0] = color(255, 127, 31);
col[1] = color(31, 255, 127);
col[2] = color(127, 31, 255);
col[3] = color(31, 127, 255);
col[4] = color(127, 255, 31);
col[5] = color(127);
}


void serialEvent(Serial myPort) {
if (myPort.available()>2) { // if receiving 3 data from serial (important!!)//
in_x = myPort.read();
in_y = myPort.read();
in_z = myPort.read();
}
}
On immediate inspection, I see that in one of the tutorials, I have a more elegent, if not potentially flawed solution for establishing communication between the board and the Arduino code in serial. I say flawed, because if the board every drops connection for some reason, the only way to reconnect is to reset the board. I do not need three graphs, just one and I prefer for it to be horizontal.
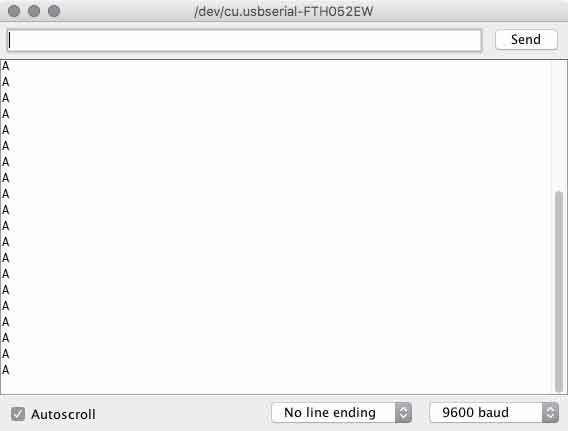
First the Arduino code is fairly straightforward. I effectively combined what I learned from the tutorials with a simple sensor to serial sketch. After configuring the pins, the board launches the serial connection and begins sending A's while waiting for something to respond with anything. Kind of like our probing outer space with Doritos commercials. I liked that chip when I was a young boy.
// Using an ATTiny44
// This is written to be used alongside Processing for visualizing sensor data
#include <SoftwareSerial.h>
SoftwareSerial mySerial = SoftwareSerial (0,1);    // RX PA1 12, TX PA0 13

// Pin Configurations
const int sensorPin = A2;  // PA2
//const int LED = A7;        // PA7
int sensorValue = 0;       // variable to store the value coming from the sensor
int outputValue = 0;        // variable to store the mapped value
char val;  // Data from serial


void setup() {
//pinMode(LED, OUTPUT);   // declare the LED as an OUTPUT:
mySerial.begin(9600);   // Set this the same on serial monitors
establishContact();  // send a byte to establish contact until receiver responds
}

void loop() {                   // read the value from the sensor every 50 ms
if (mySerial.available() >0) { // If data is available to read,
val = mySerial.read(); // read it and store it in val

if (val == '1') { // If 1 was received
  sensorValue = analogRead(sensorPin);
  //outputValue = map(sensorValue, 0, 1023, 100, 0);  //0 is dark, 100 is bright
  mySerial.println(sensorValue);  // print converted reading to Serial
  delay(200);    // calibrate for stability in readings
} else {
delay(200);
}
}
}

void establishContact() {
while (mySerial.available() <= 0) {
mySerial.println("A");  //send A
delay(300);   // adjust delay for stability
}
}
After a response does come, the board sends a reading of the phototransistor to serial everytime it receives a "1". That is the Arduino code. Incidentally, if you are trying to debug, the "1" is not printed to the serial monitor.
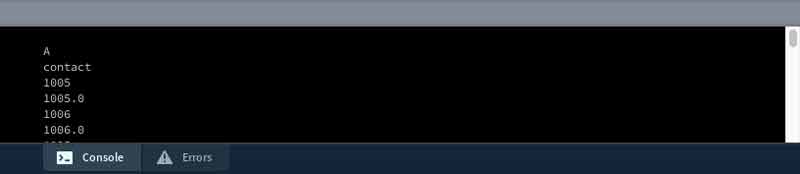
Next the Processing side of the code. I will highlight a few chunks first. This is the serial portion of the code, which is similar to the tutorial. Within the else section, I adjusted to no longer use mouse clicks for the LED, instead it grabs the data sent from the board as a string and converts it to an integer. Finally, it communicates a "1" so the board knows to send another reading. Also, null data is culled, which is good.
void serialEvent( Serial myPort) {  //put the incoming data into a String -
val = myPort.readStringUntil('\n');
if (val != null) {  //make sure our data isn't empty before continuing
val = trim(val);  //trim whitespace and formatting characters (like carriage return)
println(val);
if (firstContact == false) {
if (val.equals("A")) {  //look for 'A' string to start the handshake
  myPort.clear();   //if it's there, clear the buffer, and send a request for data
  firstContact = true;
  myPort.write("A");
  println("contact");
  delay(100);
}
}  else { //if we've already established contact, keep getting and parsing data
String [] numbers = split(val, ',');
float sensor[] = float(numbers);
println(sensor[0]);
photoT = (int)sensor[0];
}
myPort.write("1");  // when you've parsed the data you have, ask for more:
}
}
For reading data from the FTDI cable, I like this solution better.
myPort = new Serial(this, "/dev/cu.usbserial-FTH052EW", 9600);
The first half of the void draw section draws the static elements. I thought I could move this into the setup section to save computing effort but the text gets rendered strangely when I do. There are different ways to input color. One is a grayscale value, which is used on the background and fill. Another is RBG, which is used later as three variables. Rectangles in processing are drawn with at least four inputs: X, Y upper left corner coordinates and width and height. In that sequence. Any modifiers will effect everything through the code unless a new modifier is set. For instance, textAlign(RIGHT) will align all text generated after this line of code to the right. Fill(0) is a little strange because it effects vectors and text.
void draw() {
//[mostly] static elements
background(255);
fill(0);
rect(100,100,500,100);  // (a, b, c, d) (x-coord, y-coord, width, height) x &y are
upper left corner
textSize(16);
textAlign(RIGHT);
text("LUX", 75, 158);
The second half draws the dynamic elements. I start by mapping the sensor data which is 1023 for totally dark and 0 for light to values to use for reference coordinates and percentages. Then this rectangle is drawn on top of the other, as a teal color defined elsewhere. I made two lines that mark min and max readings recorded in this session and some text labels of each. The min and max are tracked in variables. Finally, decimal points are culled from floating numbers with the round function.
//[mostly]dynamic elements
float x = map(photoT, 0, 1023, 100, 0);  //map censor values for graphing, 0 is dark,
100 bright
int ax = round(x);
textAlign(LEFT);
text(ax, 625, 158);
fill(col[0]);
if (x > xMax) {
xMax = x;
}
if (0< x && x < xMin) {
xMin = x;
}
rect(100, 100, x*5, 100);
line(xMin*5+100, 75, xMin*5+100, 225);
line(xMax*5+100, 75, xMax*5+100, 225);
int xMaxText = round(xMax);
int xMinText = round(xMin);
fill(0);
textSize(12);
textAlign(CENTER);
text ("min", xMin*5+100, 250);
text (xMinText, xMin*5+100, 264);
text ("max", xMax*5+100, 58);
text (xMaxText, xMax*5+100, 44);
}
And finally here is the code in its entirety. I think there is a better solution for the color but in this way, it might be easier to make that dynamic, ie. the color of the graph heats up as the lux reading gets brighter.
import processing.serial.*;

Serial myPort;   // create an object from Serial class
boolean firstContact = false;  //check if MCU is communicating
String val;      // data received from the serial port
int photoT;      // converted string from serial port
color[] col = new color[1];
int ax;
float xMax = 0;    //tracking the highest value recorded
float xMin = 100;    //tracking the lowest value recorded
int xMinText;
int xMaxText;

void setup() {
size(700, 300);
frameRate(40);
myPort = new Serial(this, "/dev/cu.usbserial-FTH052EW", 9600);
initGraph();
}

void serialEvent( Serial myPort) {  //put the incoming data into a String -
val = myPort.readStringUntil('\n');
if (val != null) {  //make sure our data isn't empty before continuing
val = trim(val);  //trim whitespace and formatting characters (like carriage return)
println(val);
if (firstContact == false) {
if (val.equals("A")) {  //look for 'A' string to start the handshake
  myPort.clear();   //if it's there, clear the buffer, and send a request for data
  firstContact = true;
  myPort.write("A");
  println("contact");
  delay(100);
}
}  else { //if we've already established contact, keep getting and parsing data
String [] numbers = split(val, ',');
float sensor[] = float(numbers);
println(sensor[0]);
photoT = (int)sensor[0];
}
myPort.write("1");  // when you've parsed the data you have, ask for more:
}
}

void draw() {
//[mostly] static elements
background(255);
fill(0);
rect(100,100,500,100);  // (a, b, c, d) (x-coord, y-coord, width, height) x & y are upper
left corner
textSize(16);
textAlign(RIGHT);
text("LUX", 75, 158);

//[mostly]dynamic elements
float x = map(photoT, 0, 1023, 100, 0);  //map censor values for graphing, 0 is dark,
100 bright
int ax = round(x);
textAlign(LEFT);
text(ax, 625, 158);
fill(col[0]);
if (x > xMax) {
xMax = x;
}
if (0< x && x < xMin) {
xMin = x;
}
rect(100, 100, x*5, 100);
line(xMin*5+100, 75, xMin*5+100, 225);
line(xMax*5+100, 75, xMax*5+100, 225);
int xMaxText = round(xMax);
int xMinText = round(xMin);
fill(0);
textSize(12);
textAlign(CENTER);
text ("min", xMin*5+100, 250);
text (xMinText, xMin*5+100, 264);
text ("max", xMax*5+100, 58);
text (xMaxText, xMax*5+100, 44);
}

void initGraph() {
col[0] = color(31, 255, 194);  // R, G, B values
}
Download project files
I will post links to resources I have found helpful here.
Share this post...
« Previous post :: Processing : coming around.
In graduate school, I had the fortune of learning a bit of Processing, which I used in an interactive design project called FIZZLE in Hollywood. That was then, this is now. Now is a time when I have forgotten everything. Until today. From the processing website: "Processing is a simple programming environment that was created to make it easier to develop visually oriented applications with an emphasis on animation and providing users with instant feedback through interaction. The developers wanted a means to “sketch” ideas in code. As its capabilities have expanded over the past decade, Processing has come to...
Next post :: Infrared networking »
Now I that I have a master-slave network setup, I would like to see if I can get the two boards to send signals back and forth autonomously. First, I extended the sensor test sketch to react via its LED and the serial monitor. I kept the serial monitor so I could debug along the way. One board is transmitting IR signals at random intervals. The other board is checking the IR receiver and when a signal is sensed, it triggers the LED on the board to illuminate for a short time period, then resumes loking. First the code for...